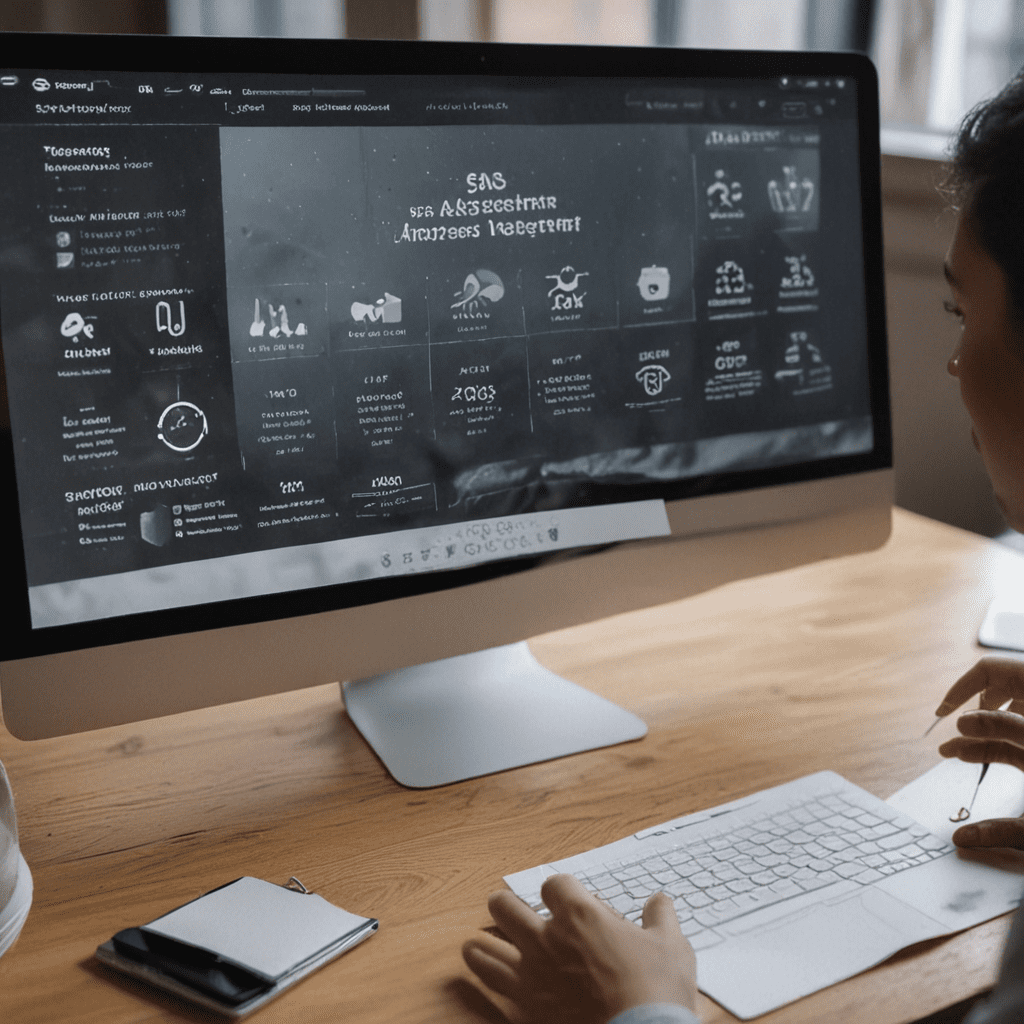
Enhancing Data Visualization with SaaS Dashboards
SaaS (Software as a Service) dashboards are transforming the way businesses visualize and analyze data. These cloud-based platforms offer a host of benefits, including:
1. Introduction to SaaS Dashboards
SaaS dashboards are web-based applications that provide real-time data visualization and analysis capabilities. They allow businesses to connect multiple data sources, create interactive dashboards, and generate reports on key metrics. SaaS dashboards are designed to be user-friendly and accessible to users of all skill levels.
2. Benefits of Using SaaS Dashboards for Data Visualization
SaaS dashboards offer numerous benefits for businesses, including:
- Centralized data view: SaaS dashboards provide a single, centralized platform for visualizing data from multiple sources, eliminating the need to access disparate systems.
- Real-time insights: SaaS dashboards update data in real-time, enabling businesses to track key metrics and make informed decisions quickly.
- Improved decision-making: Data visualization on SaaS dashboards helps users identify patterns, trends, and outliers, facilitating smarter decision-making.
- Enhanced communication: SaaS dashboards make it easy to share data visualizations with colleagues and stakeholders, promoting better communication and collaboration.
- Increased productivity: By automating data analysis and reporting tasks, SaaS dashboards save businesses time and resources, allowing them to focus on more strategic initiatives.
3. Selecting the Right SaaS Dashboard for Your Needs
Choosing the right SaaS dashboard for your business requires careful consideration of the following factors:
- Data sources: Determine which data sources you need to connect to the dashboard.
- Features: Evaluate the dashboard's features and functionality to ensure it meets your specific requirements.
- User interface: Select a dashboard with an intuitive and user-friendly interface that aligns with your team's skill level.
- Pricing: Consider the cost of the dashboard and its licensing model.
- Vendor support: Ensure the vendor provides reliable support and training resources.
4. Creating Effective Data Visualizations on SaaS Dashboards
To create effective data visualizations on SaaS dashboards, follow these best practices:
- Choose the right visualization type: Select the appropriate visualization type for the data you want to display, such as bar charts for comparisons or scatterplots for correlations.
- Use clear and concise titles and labels: Label axes and legends clearly and succinctly to help users understand the data.
- Highlight important data: Use visual cues like color and size to draw attention to key insights.
- Avoid clutter: Keep dashboards clean and focused on the most important information.
- Consider color accessibility: Use a color palette that is accessible to users with colorblindness.
5. Customizing SaaS Dashboards to Meet Specific Requirements
Many SaaS dashboards offer customization options to adapt to specific business needs. These options may include:
- Custom data sources: Connect to custom data sources using API integrations.
- Tailored dashboards: Create dashboards tailored to specific roles or departments.
- White-labeling: Rebrand dashboards with your company's logo and branding.
- Automated reports: Schedule automated reports to be delivered via email or other channels.
- Embedded dashboards: Embed dashboards into your own applications or websites.
6. Leveraging AI and Machine Learning for Advanced Data Analysis
SaaS dashboards can be integrated with AI and machine learning (ML) capabilities to enhance data analysis. These technologies enable:
- Trend forecasting: Predict future trends and patterns based on historical data.
- Anomaly detection: Identify unusual events or data points that may require attention.
- Natural language processing (NLP): Allow users to interact with dashboards using natural language queries.
- Automated insights generation: Generate insights and recommendations based on data analysis.
- Personalized dashboards: Tailor dashboards to individual users based on their roles and preferences.
7. Integrating SaaS Dashboards into Your Data Ecosystem
To maximize the value of SaaS dashboards, integrate them with your existing data ecosystem. This includes:
- Data pipelines: Connect dashboards to data sources and automate data ingestion.
- Data warehouses: Store and manage large volumes of data for centralized access.
- Business intelligence (BI) tools: Integrate dashboards with BI tools for deeper analysis and reporting.
- APIs: Use APIs to connect dashboards to other applications and systems.
- Data governance: Establish policies and processes to ensure data quality and consistency across dashboards.
8. Best Practices for Maintaining and Governing Data Visualizations
Regularly maintain and govern data visualizations to ensure accuracy and reliability. Best practices include:
- Data accuracy: Verify the accuracy of data sources and visualizations.
- Data freshness: Keep data up-to-date and ensure visualizations reflect the latest information.
- Version control: Maintain a history of changes made to dashboards and visualizations.
- Regular updates: Regularly review and update dashboards to reflect evolving business needs.
- User feedback: Regularly gather feedback from users to improve dashboard effectiveness.
9. Security Considerations for SaaS Dashboards
SaaS dashboards contain sensitive business data, so it is crucial to ensure their security. Considerations include:
- Authentication and authorization: Implement robust authentication and authorization mechanisms to control access to dashboards.
- Data encryption: Encrypt data at rest and in transit to protect against unauthorized access.
- Compliance: Ensure dashboards comply with industry regulations and data protection laws.
- Vendor due diligence: Evaluate the security practices of SaaS dashboard vendors before adopting their solutions.
- Regular security audits: Conduct regular security audits to identify and address potential vulnerabilities.
10. Future Trends in SaaS Dashboards and Data Visualization
SaaS dashboards and data visualization technologies are continuously evolving. Future trends include:
- Real-time dashboards: Dashboards that update data in real-time, providing immediate insights.
- Augmented dashboards: Dashboards enhanced with artificial intelligence and augmented reality for immersive data exploration.
- Personalized dashboards: Dashboards tailored to individual user preferences and roles.
- Cloud-based data visualization: Data visualization capabilities delivered entirely through cloud computing.
- Integration with data science platforms: Dashboards integrated with data science platforms for advanced analysis and machine learning.
FAQs:
What is a SaaS dashboard?
A SaaS dashboard is a web-based platform that provides real-time data visualization and analysis capabilities. It connects to multiple data sources, allows for interactive dashboard creation, and generates reports on key metrics.What are the benefits of using SaaS dashboards?
SaaS dashboards offer numerous benefits, including centralized data view, real-time insights, improved decision-making, enhanced communication, and increased productivity.How do I choose the right SaaS dashboard?
Consider factors such as data sources, features, user interface, pricing, and vendor support when selecting a SaaS dashboard.
How do I create effective data visualizations?
Choose the right visualization type, use clear labels, highlight important data, avoid clutter, and consider color accessibility.Can I customize SaaS dashboards?
Many SaaS dashboards offer customization options, including custom data sources, tailored dashboards, white-labeling, automated reports, and embedded dashboards.


